介绍
Loki是受Prometheus启发由Grafana Labs团队开源的水平可扩展,高度可用的多租户日志聚合系统。 开发语言: Google Go。它的设计具有很高的成本效益,并且易于操作。使用标签来作为索引,而不是对全文进行检索,也就是说,你通过这些标签既可以查询日志的内容也可以查询到监控的数据签,极大地降低了日志索引的存储。系统架构十分简单,由以下3个部分组成 :
- Loki 是主服务器,负责存储日志和处理查询 。
- promtail 是代理,负责收集日志并将其发送给 loki 。
- Grafana 用于 UI 展示。
只要在应用程序服务器上安装promtail来收集日志然后发送给Loki存储,就可以在Grafana UI界面通过添加Loki为数据源进行日志查询(如果Loki服务器性能不够,可以部署多个Loki进行存储及查询)。作为一个日志系统不关只有查询分析日志的能力,还能对日志进行监控和报警
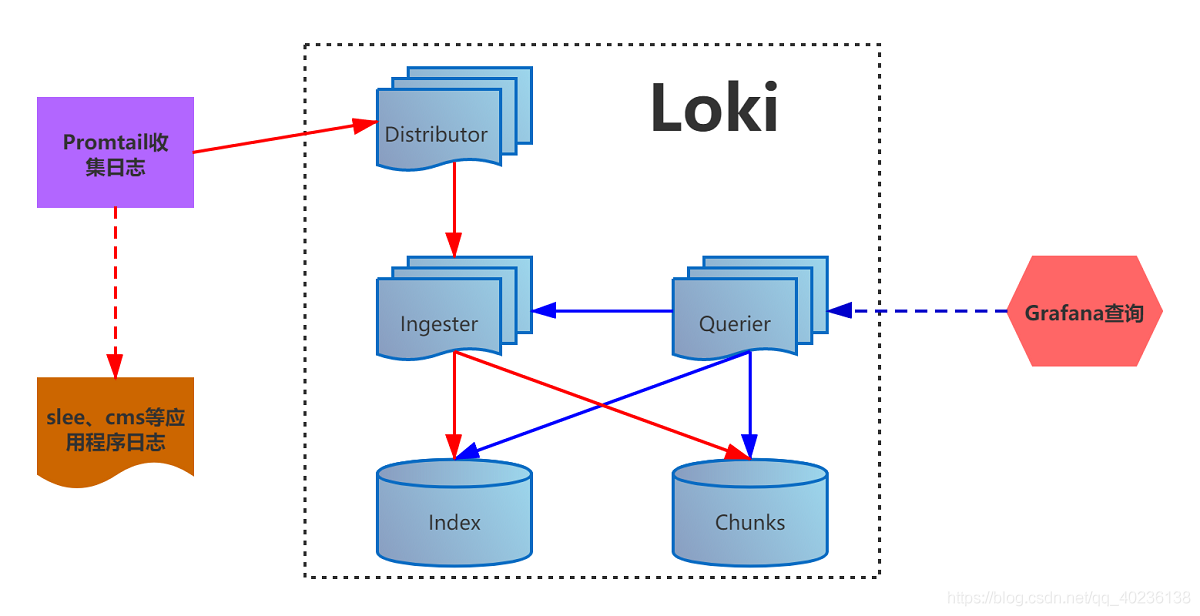
- promtail收集并将日志发送给loki的 Distributor 组件
- Distributor会对接收到的日志流进行正确性校验,并将验证后的日志分批并行发送到Ingester
- Ingester 接受日志流并构建数据块,压缩后存放到所连接的存储后端
- Querier 收到HTTP查询请求,并将请求发送至Ingester 用以获取内存数据 ,Ingester 收到请求后返回符合条件的数据 ; 如果 Ingester 没有返回数据,Querier 会从后端存储加载数据并遍历去重执行查询 ,通过HTTP返回查询结果
ELK比较
- ELK虽然功能丰富,但规模复杂,资源占用高,操作苦难,很多功能往往用不上,有点杀鸡用牛刀的感觉。
- 不对日志进行全文索引。通过存储压缩非结构化日志和仅索引元数据,Loki 操作起来会更简单,更省成本。
- 通过使用与 Prometheus 相同的标签记录流对日志进行索引和分组,这使得日志的扩展和操作效率更高。
- 安装部署简单快速,且受 Grafana 原生支持。
loki文档地址:https://grafana.com/docs/loki/latest/
下载地址: https://github.com/grafana/loki/releases
C/S架构
Server:172.16.200.6 loki grafana
Client:172.16.200.7 promtail
loki&&promtail 通过yml启动
[root@loki loki]# mkdir -p /usr/local/loki && mkdir -p /data/loki/{index,chunks}
[root@loki loki]# cd /usr/local/loki/
[root@loki loki]# wget https://github.com/grafana/loki/releases/download/v2.3.0/loki-linux-amd64.zip
[root@loki loki]# wget https://dl.grafana.com/oss/release/grafana-7.1.0-1.x86_64.rpm
[root@loki loki]# vim /usr/local/loki/loki.yaml
auth_enabled: false
server
http_listen_port: 3100
ingester:
lifecycler:
address: 172.16.200.6
ring:
kvstore:
store: inmemory
replication_factor: 1
final_sleep: 0s
chunk_idle_period: 5m
chunk_retain_period: 30s
schema_config:
configs:
- from: 2021-09-01
store: boltdb
object_store: filesystem
schema: v9
index:
prefix: index_
period: 168h #每张表的时间范围内7天
storage_config:
#标签索引存储地址
boltdb:
directory: /data/loki/index
#块文件存储地址
filesystem:
directory: /data/loki/chunks
# boltdb_shipper:
#active_index_directory: /home/data/loki
#cache_location: /home/data/loki/cache
#cache_ttl: 24h
#shared_store: s3
#aws:
#bucketnames: jn-log
# endpoint: oss-cn-hangzhou.aliyuncs.com
#region: oss-cn-hangzhou
#access_key_id: LTAI5tJrTDshuWHMDdQURu2r
#secret_access_key: LCl9123WlJvxrPZODdV5fn7z5pwRcH
limits_config:
#enforce_metric_name: false
reject_old_samples: true
reject_old_samples_max_age: 168h
ingestion_rate_mb: 20
#chunk_store_config:
#max_look_back_period: 720h
table_manager:
retention_deletes_enabled: true
retention_period: 672h
#table_manager:
# chunk_tables_provisioning:
# inactive_read_throughput: 0
# inactive_write_throughput: 0
# provisioned_read_throughput: 0
# provisioned_write_throughput: 0
# index_tables_provisioning:
# inactive_read_throughput: 0
# inactive_write_throughput: 0
# provisioned_read_throughput: 0
# provisioned_write_throughput: 0
# retention_deletes_enabled: false
# retention_period: 0[root@loki loki]# vim /etc/systemd/system/service
loki.service
[Unit]
Description=loki
After=network.target
[Service]
ExecStart=/usr/local/loki/loki-linux-amd64 \
-config.file=/usr/local/loki/loki.yml &>> /usr/local/loki/loki-3100.log
Restart=on-failure
[Install]
WantedBy=multi-user.target
[root@loki loki]# systemctl daemon-reload
[root@loki loki]# systemctl restart loki && systemctl enable loki[root@loki loki]# netstat -nutlp |grep loki
tcp6 0 0 :::3100 :::* LISTEN 6761/loki-linux-amd
tcp6 0 0 :::9095 :::* LISTEN 6761/loki-linux-amd
[root@loki loki]#
[root@loki loki]# ps -ef |grep loki
root 6761 1 0 Sep01 ? 00:00:28 /usr/local/loki/loki-linux-amd64 -config.file=/usr/local/loki/loki.yml &>> /usr/local/loki/loki-3100.log
root 8523 10196 0 11:06 pts/0 00:00:00 grep --color=auto loki[root@promtail ~]# mkdir -p /usr/local/promtail/
[root@promtail ~]# wget "https://github.com/grafana/loki/releases/download/v2.3.0/promtail-linux-amd64.zip"[root@promtail ~]# vim /usr/local/promtail/promtail.yaml
# Promtail Server Config
server:
http_listen_port: 9080
grpc_listen_port: 0
# Positions
positions:
filename: /tmp/positions.yaml
# Loki服务器的地址
clients:
- url: http://172.16.200.6:3100/loki/api/v1/push
scrape_configs:
- job_name: systemd #区分从其他日志组收集的日志
static_configs:
- targets:
- 172.16.200.7
labels:
job: systemd
host: 172.16.200.7
__path__: /var/log/messages #收集日志的路径[root@promtail ~]# /etc/systemd/system/promtail.service
[Unit]
Description=promtail
After=network.target
[Service]
ExecStart=/usr/local/promtail/promtail-linux-amd64 \
-config.file=/usr/local/promtail/promtail.yaml &>> /usr/local/promtail/promtail-9080.log
Restart=on-failure
[Install]
WantedBy=multi-user.target
[root@promtail ~]# systemctl daemon-reload
[root@promtail ~]# systemctl start promtail && systemctl enable promtail
[root@promtail ~]# netstat -nutlp |grep promtail
tcp6 0 0 :::35539 :::* LISTEN 5941/promtail-linux
tcp6 0 0 :::9080 :::* LISTEN 5941/promtail-linux访问grafana https://172.16.200.6:3000/
用户 admin
密码 admin

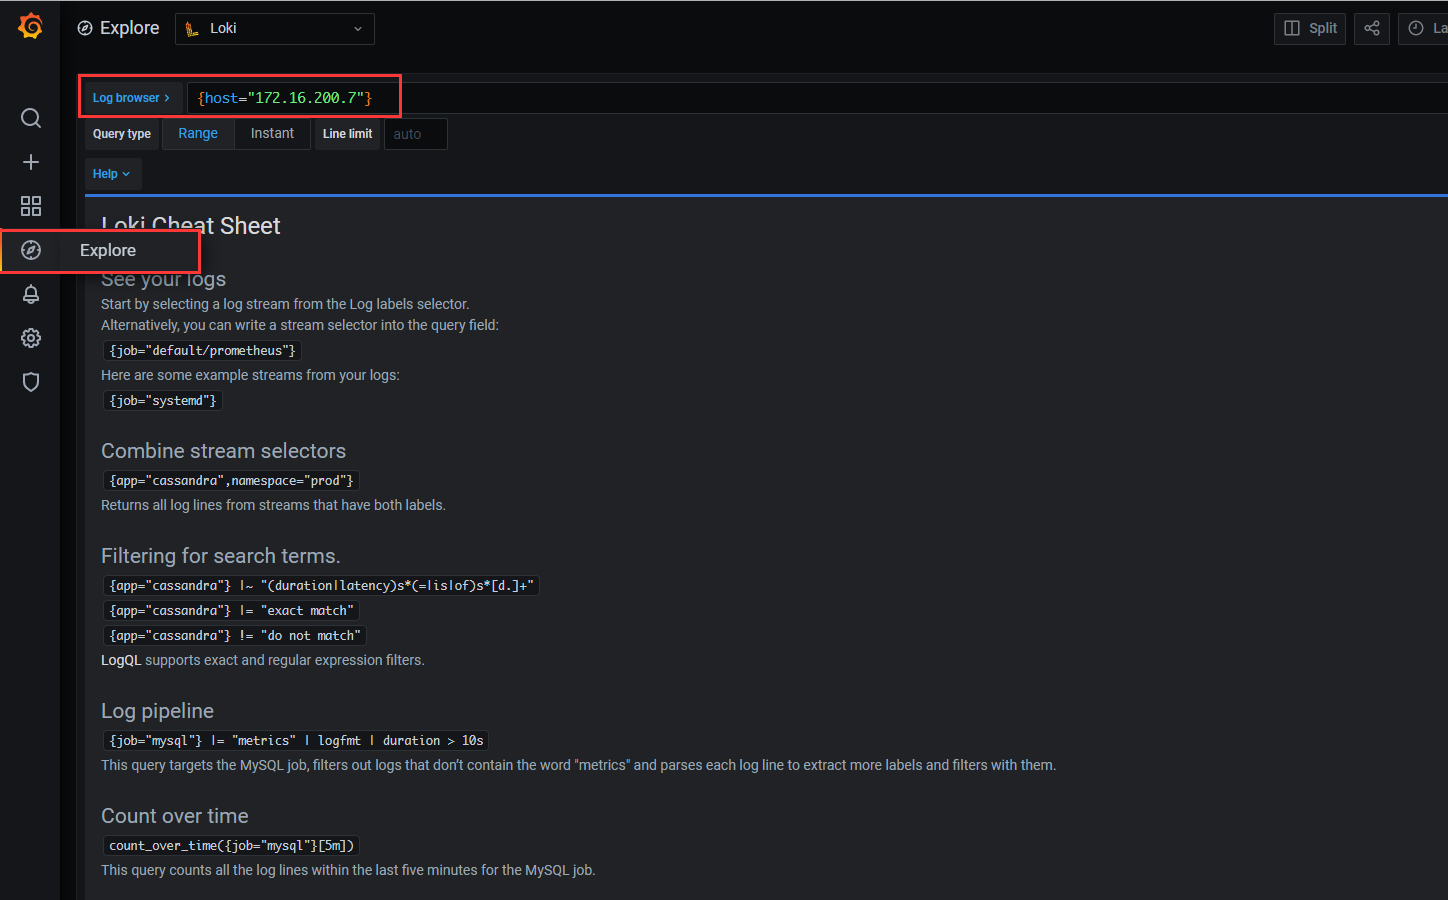
输入Loki的服务地址
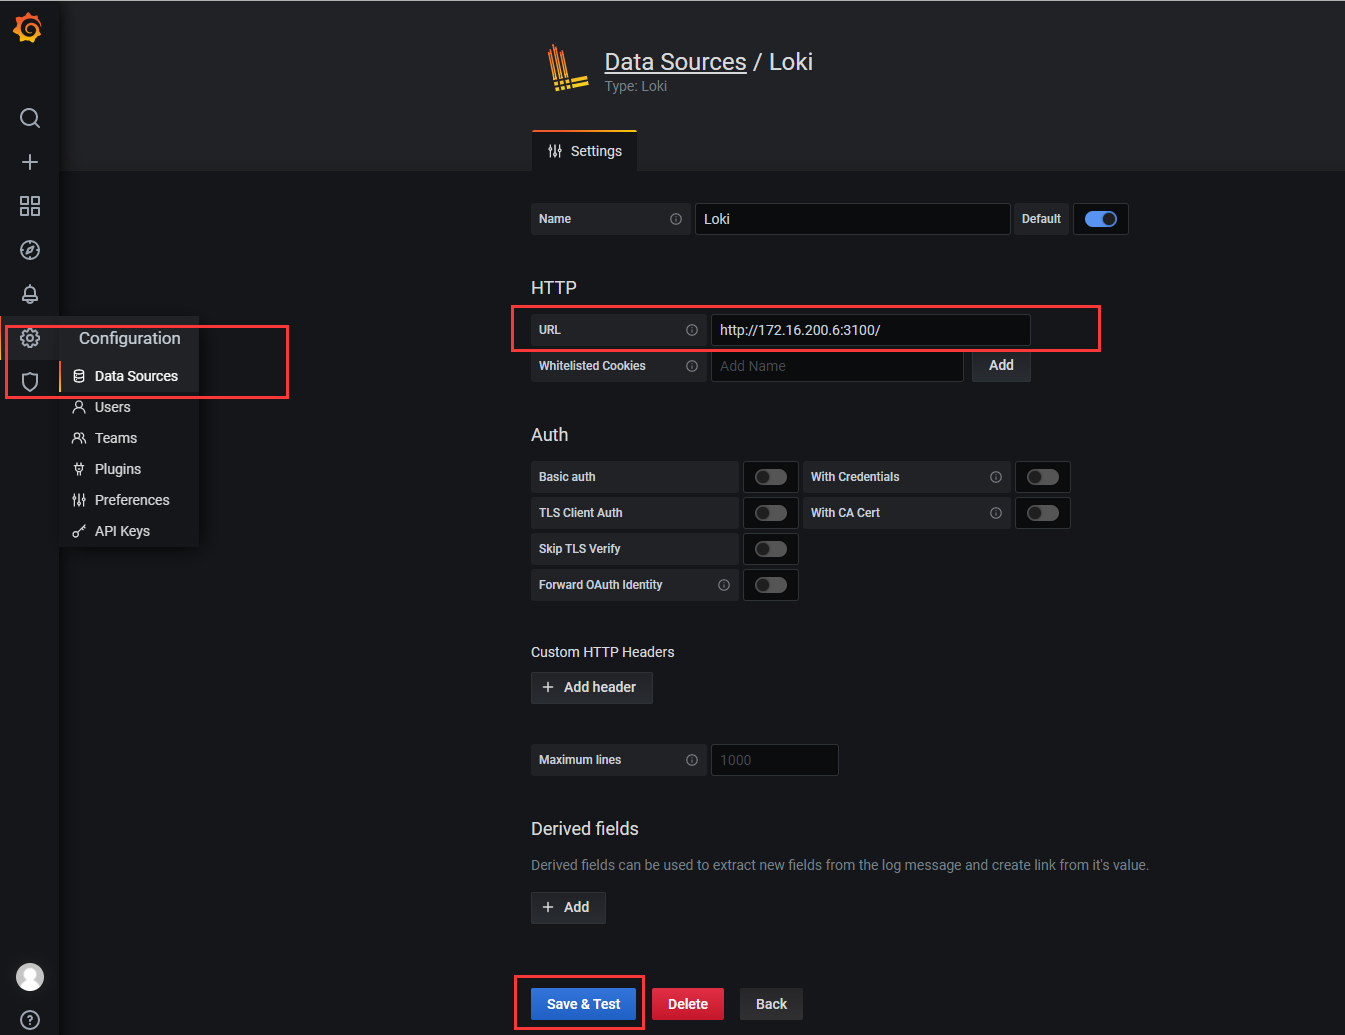
查询方式/正则匹配/help有示例