kubernetes安装文档请参照:https://lolicp.com/kubernetes/20211532.html
Master通过git拉取代码
[root@master-all ~]# git clone https://github.com/redhatxl/k8s-prometheus-grafana.git
Cloning into 'k8s-prometheus-grafana'...
remote: Enumerating objects: 21, done.
remote: Total 21 (delta 0), reused 0 (delta 0), pack-reused 21
Unpacking objects: 100% (21/21), done.
[root@master-all ~]# cd k8s-prometheus-grafana/
采用daemonset方式部署node-exporter组件
[root@master-all k8s-prometheus-grafana]# cat node-exporter.yaml
---
apiVersion: apps/v1
kind: DaemonSet
metadata:
  name: node-exporter
  namespace: kube-system
  labels:
    k8s-app: node-exporter
spec:
  template:
    metadata:
      labels:
        k8s-app: node-exporter
    spec:
      containers:
      - image: prom/node-exporter
        name: node-exporter
        ports:
        - containerPort: 9100
          protocol: TCP
          name: http
  selector:
    matchLabels:
      k8s-app: node-exporter
---
apiVersion: v1
kind: Service
metadata:
  labels:
    k8s-app: node-exporter
  name: node-exporter
  namespace: kube-system
spec:
  ports:
  - name: http
    port: 9100
    nodePort: 31672
    protocol: TCP
  type: NodePort
  selector:
    k8s-app: node-exporter
[root@master-all k8s-prometheus-grafana]# kubectl create -f node-exporter.yaml
daemonset.apps/node-exporter created
service/node-exporter created
安装Prometheus
部署Prometheus组件
rbac文件
[root@master-all k8s-prometheus-grafana]# kubectl create -f prometheus/rbac-setup.yaml
clusterrole.rbac.authorization.k8s.io/prometheus created
serviceaccount/prometheus created
clusterrolebinding.rbac.authorization.k8s.io/prometheus created
以configmap的形式管理Prometheus组件的配置文件
[root@master-all k8s-prometheus-grafana]# kubectl create -f prometheus/configmap.yaml
configmap/prometheus-config created
Prometheus deployment 文件
[root@master-all k8s-prometheus-grafana]# kubectl create -f prometheus/prometheus.deploy.yml
deployment.apps/prometheus created
Prometheus service文件
[root@master-all k8s-prometheus-grafana]# kubectl create -f prometheus/prometheus.svc.yml
service/prometheus created
安装Grafana
部署grafana组件
deployment配置文件
[root@master-all k8s-prometheus-grafana]# cat grafana/grafana-deploy.yaml
apiVersion: apps/v1
kind: Deployment
metadata:
  name: grafana-core
  namespace: kube-system
  labels:
    app: grafana
    component: core
spec:
  replicas: 1
  template:
    metadata:
      labels:
        app: grafana
        component: core
    spec:
      containers:
      - image: grafana/grafana:4.2.0
        name: grafana-core
        imagePullPolicy: IfNotPresent
        # env:
        resources:
          # keep request = limit to keep this container in guaranteed class
          limits:
            cpu: 100m
            memory: 100Mi
          requests:
            cpu: 100m
            memory: 100Mi
        env:
          # The following env variables set up basic auth twith the default admin user and admin password.
          - name: GF_AUTH_BASIC_ENABLED
            value: "true"
          - name: GF_AUTH_ANONYMOUS_ENABLED
            value: "false"
          # - name: GF_AUTH_ANONYMOUS_ORG_ROLE
          #   value: Admin
          # does not really work, because of template variables in exported dashboards:
          # - name: GF_DASHBOARDS_JSON_ENABLED
          #   value: "true"
        readinessProbe:
          httpGet:
            path: /login
            port: 3000
          # initialDelaySeconds: 30
          # timeoutSeconds: 1
        volumeMounts:
        - name: grafana-persistent-storage
          mountPath: /var
      volumes:
      - name: grafana-persistent-storage
        emptyDir: {}
  selector:
    matchLabels:
      app: grafana
      component: core
[root@master-all k8s-prometheus-grafana]# kubectl create -f grafana/grafana-deploy.yaml
deployment.apps/grafana-core created
service配置文件
[root@master-all k8s-prometheus-grafana]# kubectl create -f grafana/grafana-svc.yaml
service/grafana created
ingress配置文件
[root@master-all k8s-prometheus-grafana]# kubectl create -f grafana/grafana-ing.yaml
ingress.extensions/grafana created
验证
[root@master-all k8s-prometheus-grafana]# kubectl get svc -o wide --all-namespaces
NAMESPACE              NAME                        TYPE        CLUSTER-IP       EXTERNAL-IP   PORT(S)                  AGE     SELECTOR
default                kubernetes                  ClusterIP   10.96.0.1        <none>        443/TCP                  7h25m   <none>
kube-system            grafana                     NodePort    10.108.76.143    <none>        3000:31879/TCP           99m     app=grafana,component=core
kube-system            kube-dns                    ClusterIP   10.96.0.10       <none>        53/UDP,53/TCP,9153/TCP   7h25m   k8s-app=kube-dns
kube-system            node-exporter               NodePort    10.102.30.242    <none>        9100:31672/TCP           116m    k8s-app=node-exporter
kube-system            prometheus                  NodePort    10.106.25.38     <none>        9090:30003/TCP           112m    app=prometheus
kubernetes-dashboard   dashboard-metrics-scraper   ClusterIP   10.102.112.220   <none>        8000/TCP                 5h42m   k8s-app=dashboard-metrics-scraper
kubernetes-dashboard   kubernetes-dashboard        ClusterIP   10.111.1.77      <none>        443/TCP                  5h42m   k8s-app=kubernetes-dashboard
node-exporter
查看node-exporter: http://ip:31672/metrics

prometheus
prometheus对应的nodeport端口为30003,通过访问http://ip:30003/targets 可以看到prometheus已经成功连接上了k8s的apiserver

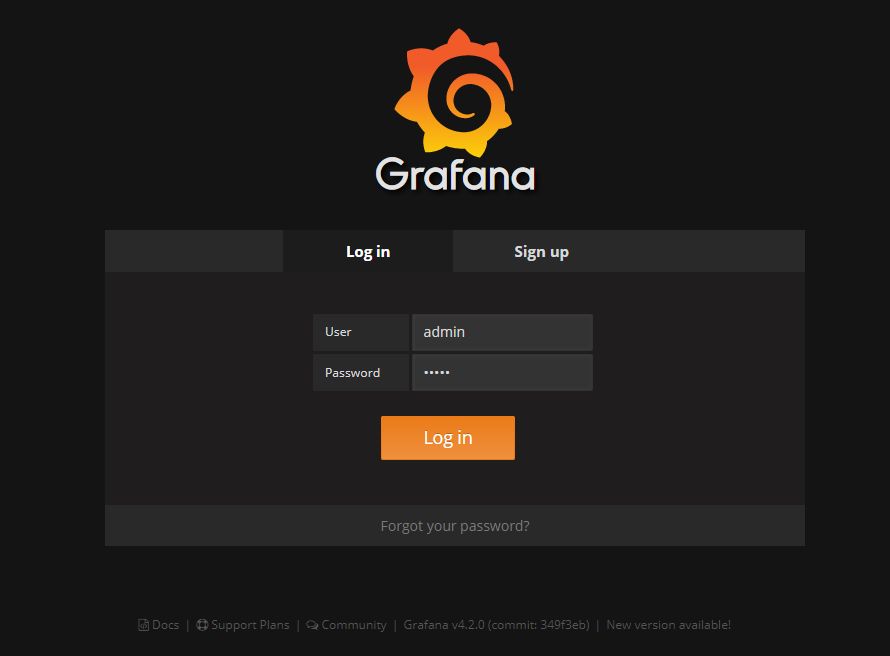
Grafana
通过端口31879进行granfa访问,默认用户名密码均为admin
 创建数据源
创建数据源
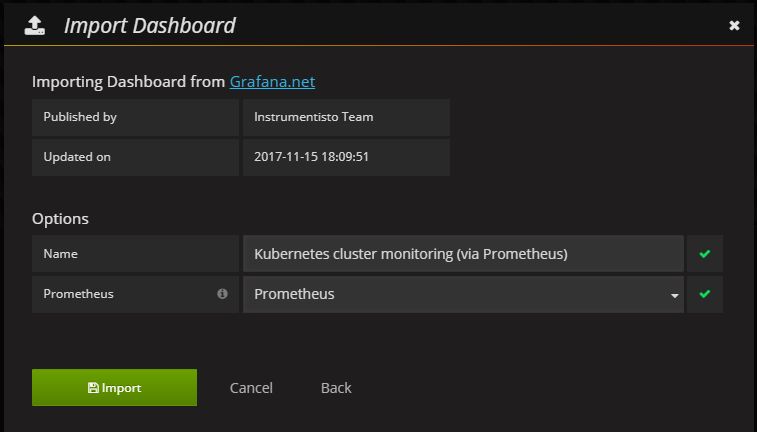
 导入仪表盘模板,ID为315

遇到的报错
1.extensions/v1beta1版本错误
[root@master-all k8s-prometheus-grafana]# kubectl create -f grafana/grafana-deploy.yaml
error: unable to recognize "grafana/grafana-deploy.yaml": no matches for kind "Deployment" in version "extensions/v1beta1"
解决方法:
[root@master-all k8s-prometheus-grafana]# sed -i 's#\(.*\)extensions/v1beta1$#\1apps/v1#g' grafana/grafana-deploy.yaml2.缺少selector
[root@master-all k8s-prometheus-grafana]# kubectl create -f grafana/grafana-deploy.yaml
error: error validating "grafana/grafana-deploy.yaml": error validating data: ValidationError(Deployment.spec): missing required field "selector" in io.k8s.api.apps.v1.DeploymentSpec; if you choose to ignore these errors, turn validation off with --validate=false
解决方法:在yaml文件中加入
selector:
    matchLabels:
      app: grafana
      component: core
3.apps/v1beta2版本错误
[root@master-all k8s-prometheus-grafana]# kubectl create -f prometheus/prometheus.deploy.yml
error: unable to recognize "prometheus/prometheus.deploy.yml": no matches for kind "Deployment" in version "apps/v1beta2"
解决方法:
[root@master-all k8s-prometheus-grafana]# sed -i 's#\(.*\)extensions/v1beta2$#\1apps/v1#g' prometheus/prometheus.deploy.yml4.extensions/v1beta1版本错误
[root@master-all k8s-prometheus-grafana]# kubectl create -f node-exporter.yaml
service/node-exporter created
error: unable to recognize "node-exporter.yaml": no matches for kind "DaemonSet" in version "extensions/v1beta1"
解决方法:
[root@master-all k8s-prometheus-grafana]# sed -i 's#\(.*\)extensions/v1beta1$#\1apps/v1#g' node-exporter.yaml5.selector缺少
[root@master-all k8s-prometheus-grafana]# kubectl create -f node-exporter.yaml
error: error validating "node-exporter.yaml": error validating data: ValidationError(DaemonSet.spec): missing required field "selector" in io.k8s.api.apps.v1.DaemonSetSpec; if you choose to ignore these errors, turn validation off with --validate=false
解决方法:在kind为DaemonSet的spec下添加
selector:
    matchLabels:
      k8s-app: node-exporter